Tag: cycling statistics

19-May-2013 : theBythams – Thorney – Stamford cycle

Well then, after doing today’s 63.77 mile cycle! I have now done just over 29,000 miles of cycling since April 2003! Which I am very pleased with to say the least! I was hoping to do more than 63.77 miles, but I had to get home to walk the dogs! Now I am at 29,000 miles, it’s looking very likely, I will hit the 30,000 mile mark by July!! 🙂

I will now leave you with the route map, elevation graph and route statistics.

Route map:-

19-05-2013 bike ride

Elevation graph:

19-05-2013 bike ride elevation graph

Route statistics:-

  • Distance: 63.77 miles.
  • Time: 4:34:24 (h:m:s).
  • Avg Speed: 13.9 mph.
  • Max Speed: 31.9 mph.
  • Elevation Gain: 673 meters.
  • Min Elevation: -1 meter (don’t believe the GPS).
  • Max Elevation: 88 meters.

Data from: Garmin Connect.

06-May-2013 : theBythams to Godmanchester

So happy. I am not long back in from the first 80+ mile cycle of 2013! I cycled so far, I made it all the way to a place called Godmanchester. It’s the most south, I have ever cycled from my village. Well I have cycled that south before, but only from Peterborough! I will need to do that route again but next time aim for St Ives, Cambridgeshire. Which would get me to around the 100 mile mark!! 🙂

I will now leave you with the route map, elevation graph, route statistics and photos.

Route map:-

06-05-2013 bike ride

Elevation graph:

06-05-2013 bike ride elevation graph

Route statistics:-

  • Distance: 81.44 miles.
  • Time: 5:55:14 (h:m:s).
  • Avg Speed: 13.8 mph.
  • Max Speed: 31 mph.
  • Elevation Gain: 1,012 meters.
  • Min Elevation: 5 meters.
  • Max Elevation: 66 meters.

Data from: Garmin Connect.

Photos from the cycle:-

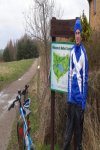
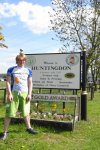
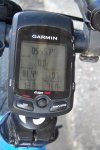
Cycling on B1043Cycling on B1043Huntingdon signGarmin Edge 705 - showing 81.44 miles

April 2013 cycling statistics

Here are my cycling statistics for April 2013. I ended up doing 519.3 this month. So 114.9 more miles than I did in April 2012. But I am still way down on this point last year. By the end of April 2012, I had done 1,714.8 miles. Right now I am only at 1,630.6 miles. So just have to hope for a good May! 🙂

Here is the data from April 2013:-

  • Total cycles: 21.
  • Total Distance: 519.33 miles.
  • Total Time: 40:14:53 (h:m:s).
  • Avg Speed: 12.9 mph.
  • Max Time: 5:19:48 (h:m:s).
  • Max Speed: 36.2 mph.
  • Avg Distance: 24.73 miles.
  • Max Distance: 68.42 miles | 21-Apr : I made it to The Wash!

Data from: Garmin Connect.

Here are my favourite cycling photos from the month:-

PBK Team Long Sleeve Skinsuit 2013PBK Team Long Sleeve Skinsuit 2013Wetsuit cyclingCycling gearPearl Izumi Team Garmin-Chipotle team kit

21-Apr-2013 : I made it to The Wash!

I am so happy, I made it the whole way The Wash for the very first time! If you have no what The Wash is, then check out en.wikipedia.org/wiki/The_Wash. Only bad thing is go all that way and can’t see any water! Still at least I can say I have made it. Been on my list of cycles for a number of years now!

I will now leave you with the route map, elevation graph, route statistics and photos.

Route map:-

21-04-2013 bike ride

The dark blue section of the route, shows new roads I covered during the cycle.

Elevation graph:

21-04-2013 bike ride elevation graph

Route statistics:-

  • Distance: 68.42 miles.
  • Time: 5:19:48 (h:m:s).
  • Avg Speed: 12.8 mph.
  • Max Speed: 31.2 mph.
  • Elevation Gain: 565 meters.
  • Min Elevation: -2 meters.
  • Max Elevation: 85 meters.

Data from: Garmin Connect.
Photos from the cycle:-

Cycling gearPBK Team Long Sleeve Skinsuit 2013PBK Team Long Sleeve Skinsuit 2013PBK Team Long Sleeve Skinsuit 2013

09-Apr-2013 : Second 60+ mile cycle of 2013!!

Just back in from what is only my second 60+ mile cycle of the year. I made it all the way to Burton on the Wolds (Just 4 miles east of Loughborough). So covered a lot of new roads. I will need to do that route again and maybe next time go to whole way in Loughborough. I also cycled that far, the GPS did not have maps for that area. So very glad, I had a OS map on me!!

I will now leave you with the route map, elevation graph and route statistics.

Route map:-

09-03-2013 bike ride

The dark blue section of the route, shows new roads I covered during the cycle.

Elevation graph:

09-04-2013 bike ride elevation graph

Route statistics:-

  • Distance: 60.22 miles.
  • Time: 4:28:29 (h:m:s).
  • Avg Speed: 13.5 mph.
  • Max Speed: 31.3 mph.
  • Elevation Gain: 896 meters.
  • Min Elevation: 43 meters.
  • Max Elevation: 143 meters.

Data from: Garmin Connect.
March 2013 cycling statistics

Here are my cycling statistics for March 2013. I am very pleased with how many miles I did. Since I was bike less for the first 9 days of March. Which also meant I had next to no way of beating last March’s total. Which was 602 miles. So I am, 135.2 miles down on what I did in March last year.

So far my yearly stands at 1,111.3 miles. Total miles since April 2003 is now at 28,026.6. Hoping to get that over 30K by July!

Here is the data from March 2013:-

  • Total cycles: 21
  • Total Distance: 466.72 miles
  • Total Time: 36:50:56 (h:m:s)
  • Avg Speed: 12.7 mph
  • Max Time: 4:53:47 (h:m:s)
  • Max Speed: 34 mph
  • Avg Distance: 22.22 miles
  • Max Distance: 61.06 miles | 21-Mar : First 60+ mile cycle of 2013!!

Data from: Garmin Connect.

Here are my favourite cycling photos from the month:-

Out cyclingOakham Road / Exton RoadCold Overton Road / Oakham Road / The CarriagewayMelton Country ParkLook at all that snow!

21-Mar-2013 : First 60+ mile cycle of 2013!!

Just done my first 60+ mile cycle of the year!! When I set off, I was going to be happy with just 40 miles. But since I was racing a mate via twitter. I had to keep going.  Also I wanted to cover lots of new roads. Which I did! Look at the blue on the map below! I think I will do, most if not all of that route again at some point. When I do first 100+ cycle of the year. Think I will use, lots of it.

I will now leave you with the route map, elevation graph, route statistics and photos.

Route map:-

21-03-2013 bike ride

The dark blue section of the route, shows new roads I covered during the cycle.

Elevation graph:

21-03-2013 bike ride elevation graph

Route statistics:-

  • Distance: 61.06 miles.
  • Time: 4:53:47 (h:m:s).
  • Avg Speed: 12.5 mph.
  • Max Speed: 31.3 mph.
  • Elevation Gain: 1,327 meters.
  • Min Elevation: 25 meters.
  • Max Elevation: 221 meters.

Data from: Garmin Connect.

Photos from the cycle:-

dsc02551dsc02556dsc02554dsc02559

19-Mar-2013 : Second 50+ mile cycle of the year

Today I did, what is only my second 50+ mile cycle of the year. I did not even mean to. I was hoping just to cycle to Oakham via Stamford and Rutland Water and back. But since it turned out to be a very nice day. I ended up cycling out of Oakham along National Cycle Network Route 63 and covered miles and miles of road I never ever been on before. Most of the time I had not idea where I was at all. It ended up being a great cycle. I will sure head out that way again!

I will now leave you with the route map, elevation graph, route statistics and photos.

Route map:-

19-03-2013 bike ride

The dark blue section of the route, shows new roads I covered during the cycle.

Elevation graph:

19-03-2013 bike ride elevation graph

Route statistics:-

  • Distance: 51.21 miles.
  • Time: 4:06:55 (h:m:s).
  • Avg Speed: 12.4 mph.
  • Max Speed: 29.9 mph.
  • Elevation Gain: 869 meters.
  • Min Elevation: 27 meters.
  • Max Elevation: 204 meters.

Data from: Garmin Connect.

Photos from the cycle:-

Oakham Road / Exton RoadCold Overton Road / Oakham Road / The CarriagewayUnnamed Road (NCR 64)Unnamed Road (NCR 64)Rutland Water cycle route sign post

14-Mar-2013 : First real test of Trek 8.3 DS Hybrid Bike

Today I give my new Trek 8.3 DS Hybrid Bike it’s first real test. Mainly since I did the longest cycle it’s done so far since getting it. Also it’s the first time I have used it off road. I used it, while cycling along the Grantham Canal towpath. I also used the bike’s bike front suspension. I normal have it locked. Since I just find, all I do is bounce up and down. So it’s nice to have suspension, but can’t see me using it that often.

I will now leave you with the route map, elevation graph and route statistics.

Route map:-

14-03-2013 bike ride

Elevation graph:

14-03-2013 bike ride elevation graph

Route statistics:-

  • Distance: 46.26 miles.
  • Time: 3:34:44 (h:m:s).
  • Avg Speed: 12.9 mph.
  • Max Speed: 34.6 mph.
  • Elevation Gain: 702 meters.
  • Min Elevation: 43 meters.
  • Max Elevation: 156 meters.

Data from: Garmin Connect.

February 2013 cycling statistics

Here are my cycling statistics for February 2013. I am pleased with the number of miles I did this last month (February). It’s just about made up for the very bad January that I had. Since I did 158.8 more miles than I did in February 2012.

So far my yearly stands at 644.6 miles. Total miles since April 2003 is now at 27,559.9.

Here is the data from February 2013:-

Data from: Garmin Connect.

Here are my favourite cycling photos from the month:-

Rutland Water

Rutland Water

A1 between Little Ponton and Great Ponton

Out cycling