Tag: cycling

All the routes I have cycled on a single map

Here for the first time ever is every single GPS cycle track on a single UK map. The data is from 13th September 2008 (when I got the Garmin Edge 705 GPS), till 15th September 2012. In that time I have logged 16,498.95 miles.

The map to the right includes the End to End cycle, that I did in August 2009. Also the places I have cycling to from Killearn and Little Bytham.

I made the map using Memory-Map.

Done 256.3 miles this month, got another 288 to do

I have done 256.3 miles so far this month. Got another 288 to do, to bet September 2011 total. If I had a whole month to do that number of miles in. It would be easy. But since I go on holiday on the 23rd, only got up till then to do it! So the weather better play nice!!

I will now leave you with the route map, elevation graph, route statistics and photos.

Route map:-

Elevation graph:

Route statistics:-

  • Distance: 26.24 miles
  • Time: 26.24 (h:m:s)
  • Avg Speed: 12.4 mph
  • Max Speed: 30.6 mph
  • Elevation Gain: 387 meters
  • Min Elevation: 23 meters
  • Max Elevation: 95 meters

Data from: Garmin Connect.

Photos from the cycle:-

PBK Team Long Sleeve Skinsuit

PBK Team Long Sleeve Skinsuit

PBK Team Long Sleeve Skinsuit

Done just over 200 miles of cycling so far this month…

I am pleased with myself. So far I have done, just over 200 miles of cycling this month. Yes I know that really that much, still not bad since I have only done 6 cycles so far in September. Can’t see this month being the best month for the number of miles I get to do. Since I am going on holiday on the 23rd and not back till the 30th. So all the cycling needs to be done by then.

I will now leave you with the route map, elevation graph and route statistics.

Route map:-

Elevation graph:

Route statistics:-

  • Distance: 45.30 miles
  • Time: 3:25:00 (h:m:s)
  • Avg Speed: 13.3 mph
  • Max Speed: 33.4 mph
  • Elevation Gain: 387 meters
  • Min Elevation: 43 meters
  • Max Elevation: 193 meters

Data from: Garmin Connect.

Place’s I have cycled to from Little Bytham : updated 05/09/2012

Just posted an updated map of all the places, I have cycled to from Little Bytham. The dark blue lines are the extra routes, I have added since last updating this map on 14/06/2012.

More cycling maps can be found at www.gordon-valentine.com/zenphoto/cycling/, which also include the End to End cycle maps.

Q2 2012 cycling statistics

Sorry it’s taken me so long to get the Q2 2012 cycling statistics on-line. Here they are at long last!

Here is the data from the second quarter (April to June) of 2012:-

Longest cycle each month:-

Data from: Garmin Connect.

If you have any ideas for other data you would like to see here, then let me know!

August 2012 cycling statistics

Here are my cycling statistics for August 2012. I did 803.64 miles, making it the second most, I have ever done in a single month. Only second place to the End to End cycle month back in August 2009. I also did more miles using the bike than the car. I only used the car for 592.3 miles.

So far my yearly stands at 4,061.2 miles. Total miles since April 2003 now stands at 25,687. So I break the 26,000 mile mark before the year is out!!

Here is the data from August 2012:-

  • Total cycles: 28
  • Total Distance: 803.64 miles
  • Total Time: 64:16:07 (h:m:s)
  • Avg Speed: 12.5 mph
  • Max Time: 8:01:12 (h:m:s)
  • Max Speed: 34 mph
  • Avg Distance: 28.70 miles
  • Max Distance: 101.61 miles – Second ever 100 mile bike ride : 22/08/2012

Data from: Garmin Connect.

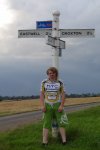
Here are my favourite cycling photos from the month:-

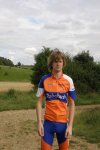
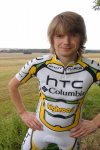
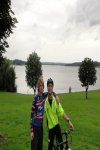
Out cyclingRabobank Cycling Team kitNalini Columbia Highroad Team kitOut cyclingRutland Water

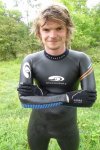
First wetsuit cycle since May 2012

Since it had been pissing it down all day, I made up my mind to make the most of it. So I put on my blueseventy axium wetsuit and went out a cycle. Below are some photos I took during the cycle :).

Wetsuit cyclingWetsuit cyclingWetsuit cyclingWetsuit cycling

More photos from the set can be found at www.gordon-valentine.com/zenphoto/me/2012/page/11

Cycling around Rutland Water with friends

Today I had great fun cycling to then around Rutland Water. So a total of 45.60 by the time I got back home. When I got to Rutland Water, I met up with Tristan and his boyfriend Dave. I have known Tristan for year, but not seen him in many years. First time ever meeting his other half. So I then did the Rutland Water section with them both. It was so much fun, hope we can all find the time to do it again at some point :).

I now only have 10.6 miles to go and I will have done the second most ever miles in a single year. Then I only have last years record of 5,066 miles to beat. Can’t see me doing that, since I have to find the time to do another 1,000 miles before the year is out.

I will now leave you with the route map, elevation graph, route statistics and photos.

Route map:-

Elevation graph:

Route statistics:-

  • Distance: 45.60 miles
  • Time: 3:43:27 (h:m:s)
  • Avg Speed: 12.2 mph
  • Max Speed: 31.6 mph
  • Elevation Gain: 387 meters
  • Min Elevation: 43 meters
  • Max Elevation: 128 meters

Data from: Garmin Connect.

Photos from the cycle:-

Horse and Jockey. St Marys Road, Manton

Rutland Water

Photos from today’s mini 35 mile cycle

Here are some photos from today’s mini 35.24 mile cycle.

Route statistics:-

  • Distance: 35.24 miles
  • Time: 2:51:17 (h:m:s)
  • Avg Speed: 12.3 mph
  • Max Speed: 34 mph
  • Elevation Gain: 346 meters
  • Min Elevation: 43 meters
  • Max Elevation: 128 meters

Data from: Garmin Connect.