At long last, I’ve got around to joining Strava! So please check out my profile @ www.strava.com/athletes/gsvalentine.

At long last, I’ve got around to joining Strava! So please check out my profile @ www.strava.com/athletes/gsvalentine.
I’ve been very bad at doing posts about my cycling statistics this year! Mainly since I’ve been very bad at cycling! So not really been wanting to tell the world that FACT!
But here are my cycling statistics for October 2015. I did 313.20 miles. Which makes it the second best month of the year! Which is still not great, since in October of last year I did 401.3 miles!
Here is the data from October 2015:-
Data from: Garmin Connect.
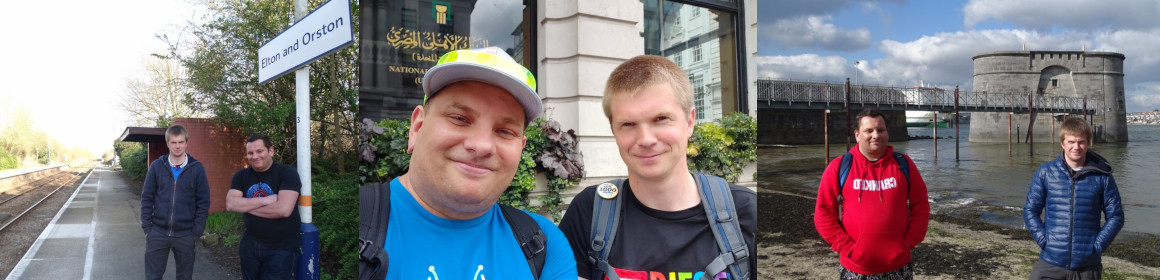
Here are my favourite cycling photos from the month:-


Here are my cycling statistics for July 2015. This month, I did only did 258.1 miles, was hoping to reach at least 500 miles. But my bike was off the road for a good number of weeks!!


I was sure that my bike, was a write off. But lucky someone, I know had one look at it and said it was easy for him to fix! In the end, it only cost me £25! Just hope, that in August. I have a better cycling month!!!
Here is the data from July 2015:-
Data from: Garmin Connect.
Here are my favourite cycling photos from the month:-


I was hoping to get out yesterday for a cycle. But had to wait till today! Yesterday the temperature in my part of the UK got up to 35C, which if you ask me, is just way to hot for cycling in!
So today, I did 34.10 miles on the bike. Which I am more than happy with! But this month cycling wise is going to be hard work! Since in July of last year, I did 705.2 miles! I need to get a hell of a lot of miles in this month!!
I will now leave you with the route map, route statistics and photos.
Route map:-

Elevation graph:-

Route statistics:-
Data from: Garmin Connect.
Photos from the cycle:-


Here are my cycling statistics for June 2015. This month, I did 376.25 miles, was hoping to reach at least 400. But still just about pleased with that number. I did set a new record for the fastest, I’ve gone on my bike, I got up to 40 mph! 🙂
Here is the data from June 2015:-
Data from: Garmin Connect.
Here are my favourite cycling photos from the month:-


That was a good cycle! Even found a new road, I’ve always past and never noticed it before! I only did 30 miles, I was hoping to do more. But had to get back to pick a mate up from the train station.
So far this year, I’ve only done 1,056.8 miles. By this time last year, it was 2,730.5. So I am 1,673.7 miles down! On the same point last year! Can’t see me making them number of miles up, before the end of the year! 🙁
I will now leave you with the route map, route statistics and photos.
Route map:-

Elevation graph:-

Route statistics:-
Data from: Garmin Connect.
Photos from the cycle:-


It’s a bit bad to think, we’re already half way into 2015 and I’ve only done two 50+ mile cycles! But now, I’ve normally done lots of them! So let’s hope, I have the will power to get many more in!
I will now leave you with the route map, route statistics and photos.
Route map:-

Elevation graph:-

Route statistics:-
Data from: Garmin Connect.
Photos from the cycle:-


OMG! So happy with the speed I got up to, on my bike! Got it up to 39.6 mph. Don’t think, I have ever gone so fast on my bike! Don’t even think, I got up to that speed during the End to End cycle! The hill I used was not even that big! Watch the video!! Which I will post later…
I will now leave you with the route map, elevation graph and route statistics.
Route map:-

Elevation graph:-

Route statistics:-
Data from: Garmin Connect.
Well happy with my first cycle of the month. I did 28.11 miles, which may not sound a lot. But it was very, very windy the whole cycle!
I will now leave you with the route map, elevation graph and route statistics.
Route map:-

Elevation graph:-

Route statistics:-
Data from: Garmin Connect.
Here are my cycling statistics for May 2015. Did 100 of times better, than I did in April! Then that’s not hard at all! Since last month, I only did 11.21 miles. This month, I did 275.14 miles. I was hoping to do at least 300 miles. Still it’s much better than, I’ve been doing!!
Now we’re into June, I need to ready start getting the miles in! Hope the weather starts to warm up! Want some good warm days, so I can start cycling into work!
Here is the data from May 2015:-
Data from: Garmin Connect.
Here are my favourite cycling photos from the month:-


