Just to think I was sure, I was not going to get any more cycling in during my time in Scotland. Well I was wrong. I found the time to cycle from Killearn to Rowardennan. Bring my total number of miles while up in Scotland to 144.21. So not to bad for just four cycles. It’s also only the second time, I have ever done this cycle. Vlog to follow soon..
I will now leave you with the route map, elevation graph, route statistics and photos.
Route map:-

Elevation graph:-

Route statistics:-
- Distance: 30.82 miles.
- Time: 2:36:56 (h:m:s).
- Avg Speed: 11.8 mph.
- Max Speed: 27.1 mph.
- Elevation Gain: 542 meters.
- Min Elevation: 12 meters.
- Max Elevation: 98 meters.
Data from: Garmin Connect.
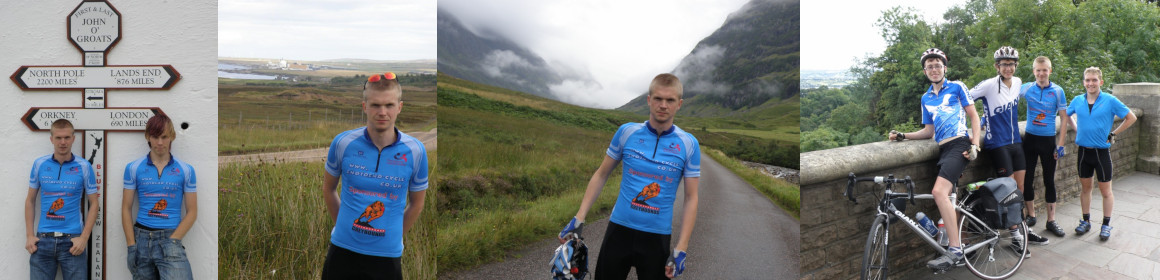
Photos from the cycle:-


")


