Tag: cycling statistics

28-Jan-2013 : First wetsuited cycle of 2013!

Well pleased with myself. At first I was not going to do any cycling at all today, due to strong winds. When I checked the wind speed before setting up is was showing wind speeds of 60 mph. But since my miles so far this month has been very, very low. Due to having about 2 week of no cycling due to snow and ice. I made up my mind, to hell if it and went out! I ended up doing the longish cycle of the year so far. I did 28.94 miles, but my avg speed was a bit on the slow side, to the very strong head winds.

It also happens to be my first wetsuited cycle of the year!! The wind was so cold, I so glad I had it on!

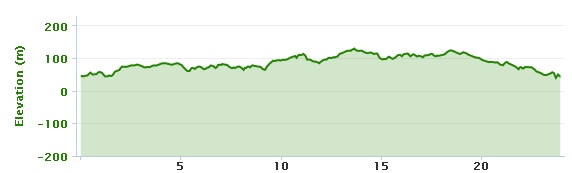
I will now leave you with the route map, elevation graph, route statistics and photos.

Route map:-

28-01-2013 bike ride

Elevation graph:

28-01-2013 bike ride elevation graph

Route statistics:-

  • Distance: 28.94 miles
  • Time: 2:45:12 (h:m:s)
  • Avg Speed: 10.5 mph
  • Max Speed: 28.2 mph
  • Elevation Gain: 332 meters
  • Min Elevation: 43 meters
  • Max Elevation: 136 meters

Data from: Garmin Connect.

Photos from the cycle:-

Wetsuit cycling

Wetsuit cycling

Wetsuit cycling

08-Jan-2013 : Third cycle of 2013!

Now done my third cycle of 2013. You may have noticed I have been posting every cycle route of the year so far. The aim is, I will do a post about every cycle over 20 miles. Does mean, I will need to try to do lots of different routes. If I don’t, you will get bored of seeing much the same maps all the time!

I will now leave you with the route map, elevation graph and route statistics.

Route map:-

08-01-2013 bike ride

Elevation graph:

08-01-2013 bike ride elevation graph

Route statistics:-

  • Distance: 23.96 miles.
  • Time: 1:57:29 (h:m:s).
  • Avg Speed: 12.2 mph.
  • Max Speed: 36.1 mph.
  • Elevation Gain: 244 meters.
  • Min Elevation: 38 meters.
  • Max Elevation: 129 meters.

Data from: Garmin Connect.

07-Jan-2013 : Second cycle of 2013!

Now done my second cycle of 2013. Don’t worry, I will start to think of a new title soon. If I don’t, will soon end up being 100th cycle of the year!! Jokes!!

I will now leave you with the route map, elevation graph and route statistics.

Route map:-

07-01-2013 bike ride

Elevation graph:

07-01-2013 bike ride elevation graph

Route statistics:-

  • Distance: 22.20 miles.
  • Time: 1:46:21 (h:m:s).
  • Avg Speed: 12.5 mph.
  • Max Speed: 33.3 mph.
  • Elevation Gain: 215 meters.
  • Min Elevation: 44 meters.
  • Max Elevation: 143 meters.

Data from: Garmin Connect.

06-Jan-2013 : First cycle of 2013!

That’s 2013 cycling wise off to a great start! I did 24.71 miles. Which I am well happy with. Now only got another 376.29 miles to go, to beat the record number of miles. I set in January 2012 (last year).

I will now leave you with the route map, elevation graph and route statistics.

Route map:-

06-01-2013 bike ride

Elevation graph:

06-01-2013 bike ride elevation graph

Route statistics:-

  • Distance: 24.71 miles.
  • Time: 2:00:19 (h:m:s).
  • Avg Speed: 12.3 mph.
  • Max Speed: 29 mph.
  • Elevation Gain: 270 meters.
  • Min Elevation: 29 meters.
  • Max Elevation: 128 meters.

Data from: Garmin Connect.

Q4 2012 cycling statistics

Here is the data from the fourth quarter (October to December) of 2012:-

Longest cycle each month:-

Data from: Garmin Connect.

If you have any ideas for other data you would like to see here, then let me know!

December 2012 cycling statistics

Garmin Edge 705 GPSYes I know that December is not fully over. But I am now in Scotland till next year! So will not be doing any more cycling till I get back. So I may as well just post the cycling statistics from December now.

My yearly total now stands at 5,289.5 miles. Total miles since April 2003 is now at 26,915.3.

Here is the data from December 2012:-

  • Total cycles: 8
  • Total Distance: 142 miles
  • Total Time: 11:37:18 (h:m:s)
  • Avg Speed: 12.2 mph
  • Max Time: 2:16:29 (h:m:s)
  • Max Speed: 35.5 mph
  • Avg Distance: 17.75 miles
  • Max Distance: 26.94 miles

Data from: Garmin Connect.

10-Dec-2012 : Cycle route and statistics

The route of today’s cycle, may not have been the most interesting in the world. But in December when you can never tell what the weather is going to be like, I am just happy to get out a cycle!

I will now leave you with the route map, elevation graph and route statistics.

Route map:-

Elevation graph:

Route statistics:-

  • Distance: 15.24 miles.
  • Time: 1:15:17 (h:m:s).
  • Avg Speed: 12.1 mph.
  • Max Speed: 35.5 mph.
  • Elevation Gain: 152 meters.
  • Min Elevation: 43 meters.
  • Max Elevation: 95 meters.

Data from: Garmin Connect.

9-Dec-2012 : Cycle route and statistics

Well happy with today’s cycle route. I ended up doing 26.9 miles, which is the longest cycle of the month so far. Also worked out well getting to cycle next to Rutland Water for a small section of the cycle.

I will now leave you with the route map, elevation graph and route statistics.

Route map:-

Elevation graph:

Route statistics:-

  • Distance: 26.9 miles.
  • Time: 2:16:29 (h:m:s).
  • Avg Speed: 11.8 mph.
  • Max Speed: 29.1 mph.
  • Elevation Gain: 221 meters.
  • Min Elevation: 28 meters.
  • Max Elevation: 143 meters.

Data from: Garmin Connect.

November 2012 cycling statistics

Here are my cycling statistics for November 2012. I did 235.4 miles, which is 18.8 miles less than I did in November of last year :(. Mainly due to having man flu the last week of November.

So far my yearly stands at 5,147.5 miles. Total miles since April 2003 now stands at 26,773.3.

Here is the data from November 2012:-

  • Total cycles: 12
  • Total Distance: 235.39 miles
  • Total Time: 19:46:19 (h:m:s)
  • Avg Speed: 12.5 mph
  • Max Time: 2:24:21 (h:m:s)
  • Max Speed: 34.4 mph
  • Avg Distance: 19.56 miles
  • Max Distance: 28.61 miles

Data from: Garmin Connect.

Here are my favourite cycling photos from the month:-

Out cycling

Out cycling

Out cycling

Cycling at Twyford Wood

Getting extra wet out cycling

2-Dec-2012 : Cycle route and statistics

December 2012 is off to a flying start. The route I did today covered 25.06 miles. It also took me into three counties Lincolnshire (the one I live in), Leicestershire and Rutland. So let’s hope I can keep this up for the rest of the month.

I will now leave you with the route map, elevation graph and route statistics.

Route map:-

Elevation graph:

Route statistics:-

  • Distance: 25.06 miles.
  • Time: 1:58:17 (h:m:s).
  • Avg Speed: 12.7 mph.
  • Max Speed: 28.1 mph.
  • Elevation Gain: 218 meters.
  • Min Elevation: 44 meters.
  • Max Elevation: 163 meters.

Data from: Garmin Connect.