Tag: VeloViewer Infographic

VeloViewer Infographic : 22 April 2022 @veloviewer

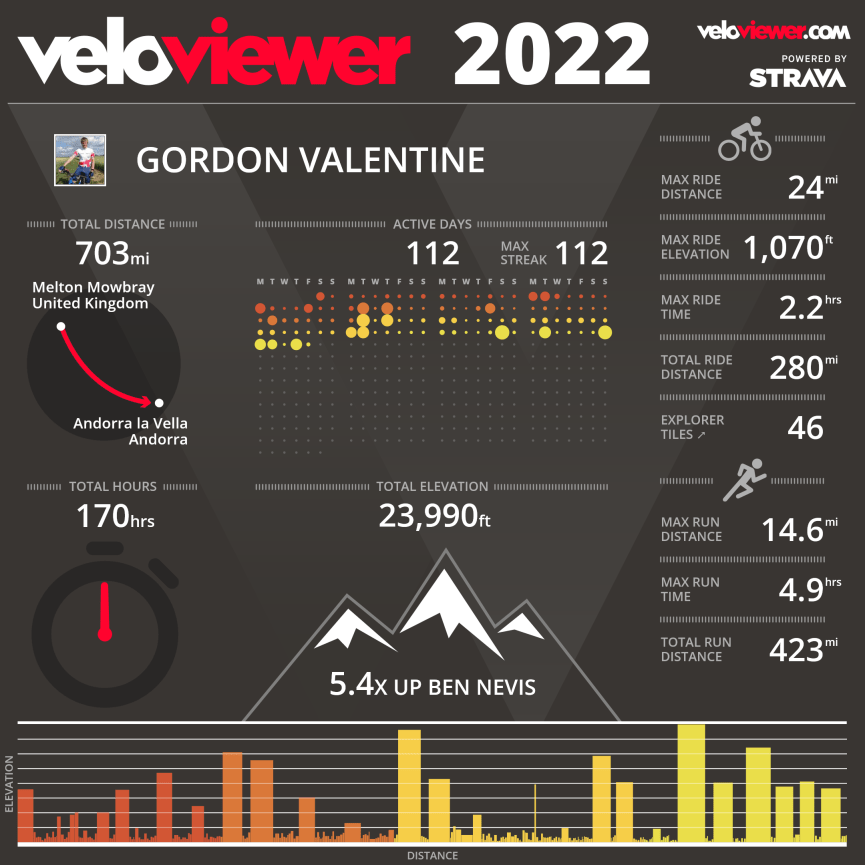
Going by my VeloViewer Infographic, I’ve had 112 active days so far in 2022! Which means, I’ve done at least one cycle or walk each day so far this year!

Hard to believe, that I’ve still done more walking so far in 2022, than cycling! Only cycled 280 miles, but I’ve walked 423 miles! But the gap is slowly starting to close…

Where it says running… That’s my walking data!

VeloViewer Infographic : 18 April 2022 @veloviewer

Going by my VeloViewer Infographic, I’ve had 108 active days so far in 2022! Which means, I’ve done at least one cycle or walk each day so far this year!

Hard to believe, that I’ve still done more walking so far in 2022, than cycling! Only cycled 234 miles, but I’ve walked 406 miles!

Where it says running… That’s my walking data!
VeloViewer Infographic : 31 March 2022 @veloviewer

Going by my VeloViewer Infographic, I’ve had 90 active days so far in 2022! Which means, I’ve done at least one cycle or walk each day so far this year!

Still hard to believe, that I’ve done more walking so far in 2022, than cycling! Only cycled 170 miles, but I’ve walked 350 miles! Really do need to fix that one and SOON!

Where it says running… That’s my walking data!

VeloViewer Infographic : 1 March 2022 @veloviewer

Going by my VeloViewer Infographic, I’ve had 60 active days so far in 2022! Which means, I’ve done at least one cycle or walk each day so far this year!

Where it says running… That’s my walking data!

VeloViewer Infographic : 22 February 2022 @veloviewer

Time to update my VeloViewer Infographic again… Since today, I walked 14.6 miles, making it the longest one of so 2022 so far…

So far, I’ve done 288 miles of exercise this year. Which is made up of cycling and walking. All recorded via GPS.

Also had 53 active days… Which means, I’ve done at least one cycle or walk each day so far this year!

Where it says running… That’s my walking data!

VeloViewer Infographic : 17 February 2022 @veloviewer

Here is my third VeloViewer Infographic of 2022. Which shows all my cycling and walking data from 01/01/2022 to 17/02/2022.

So far, I’ve done 262 miles of exercise this year. Which is made up of cycling and walking. All recorded via GPS.

Also had 48 active days… Which means, I’ve done at least one cycle or walk each day so far this year!

Where it says running… That’s my walking data!

VeloViewer Infographic : 5 February 2022 @veloviewer

Here is my second VeloViewer Infographic of 2022. Which shows all my cycling and walking data from 01/01/2022 to 05/02/2022.

So far, I’ve done 219 miles of exercise this year. Which is made up of cycling and walking. All recorded via GPS.

Also had 36 active days… Which means, I’ve done at least one cycle or walk each day so far this year!

Where it says running… That’s my walking data!

VeloViewer Infographic : 17 January 2022 @veloviewer

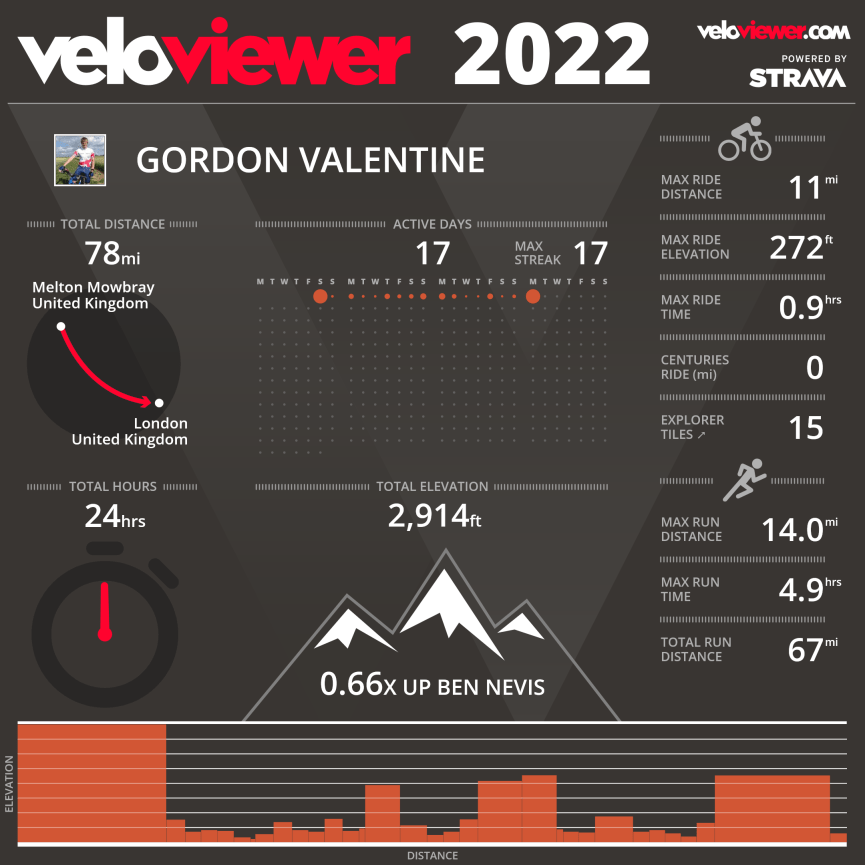
Here is my first VeloViewer Infographic of 2022. Which shows all my cycling and walking data from 01/01/2022 to 17/01/2022.

So far, I’ve done 78 miles of exercise this year. Which is made up of cycling and walking. All recorded via GPS.

Also had 17 active days… Which means, I’ve done at least one cycle or walk each day so far this year!

Where it says running… That’s my walking data!

VeloViewer Infographic : 29 October 2021 @veloviewer

Here is the updated version of my VeloViewer Infographic. Which shows all my cycling and walking data from 01/01/2021 to 29/10/2021.

Where it says running… That’s my walking data!
VeloViewer Infographic : 4 October 2021 @veloviewer

Here is the updated version of my VeloViewer Infographic. Which shows all my cycling and walking data from 01/01/2021 to 04/10/2021.

Where it says running… That’s my walking data!