That truly was an amazing cycle! First time, I’ve done in Scotland in a long time! This route, more than made for not cycling in Scotland for a good number of years!
The cycle took me from Killearn to Balfron, then to Fintry then over the Crow Road! Then into Strathblane, up onto the Stockiemuir then back into Killearn via Gartness Road!
Check out the killer hills the route took me over at www.strava.com/activities/725740790
I will now leave you with the route map, elevation graph, route statistics and photos.
Route map:-

Elevation graph:-

Route statistics:-
- Start time: 12:10pm
- Distance: 33.09 miles
- Time: 2:54:46 (h:m:s)
- Elapsed Time: 4:58:50 (h:m:s)
- Avg Speed: 11.4 mph
- Max Speed: 33.1 mph
- Elevation Gain: 701 meters
- Min Elevation: 16 meters
- Max Elevation: 340 meters
Data from: Garmin Connect.
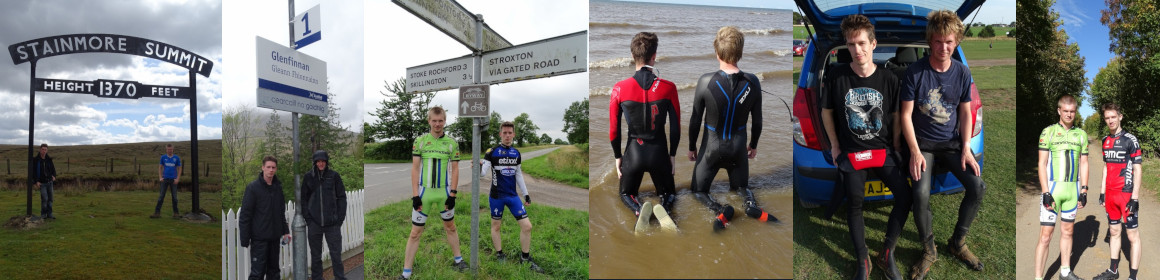
Photos:-


