Tag: cycling statistics

27-May-2015 : A nice mini 21 mile cycle!

At long, long last. Think I can say I’ve got the cycling bug again!! Starting to get the miles in at long last! So far done 246.93 miles this month. So only got to do another 10.8 miles and I will have done more than in May of last year

Still got a hell of a lot of catching up to do! By time, last year. I had already done 2,329.2 miles. So far, I’ve only done 692.8 miles. So in another words, I am down 1,636.4 miles on this time, last year!!

So today, I only did 21.13 miles! But every bit helps!!

I will now leave you with the route map, elevation graph and route statistics.

Route map:-

27-05-2015 - bike ride route map

Elevation graph:-

27-05-2015 - bike ride elevation graph

Route statistics:-

  • Start time: 1:18 pm.
  • Distance: 21.1 miles.
  • Time: 1:50:35 (h:m:s).
  • Elapsed Time: 2:10:14 (h:m:s).
  • Avg Speed: 11.5 mph.
  • Max Speed: 36.7 mph.
  • Elevation Gain: 198 meters.
  • Min Elevation: 43 meters.
  • Max Elevation: 100 meters.

Data from: Garmin Connect.

26-May-2015 : Four county’s cycle

Since I cycled in three county’s yesterday. Wanted to go one better and take in four this time! I started off in Lincolnshire, the county I live in. Also covered Rutland, Cambridgeshire and Northamptonshire. They are in no order at all. Since I went in and out of both Rutland and Lincolnshire a number of times.

During this cycle I covered 37.16 miles. Making it the longest cycle of the month so far! So just have hope, the weather is also good, this Thursday. Since it’s the last chance, I have the time, to get a long cycle in!

I will now leave you with the route map, elevation graph and route statistics.

Route map:-

26-05-2015 - bike ride route map

Elevation graph:-

26-05-2015 - bike ride elevation graph

Route statistics:-

  • Start time: 2:16 pm.
  • Distance: 37.16 miles.
  • Time: 2:51:33 (h:m:s).
  • Elapsed Time: 3:56:11 (h:m:s).
  • Avg Speed: 13 mph.
  • Max Speed: 34 mph.
  • Elevation Gain: 307 meters.
  • Min Elevation: 15 meters.
  • Max Elevation: 89 meters.

Data from: Garmin Connect.

Photos from the cycle:-

Cannondale Pro Cycling Team 2014

Cannondale Pro Cycling Team 2014

Cannondale Pro Cycling Team 2014

25-May-2015 : Three county’s cycle

I this a three county’s cycle. Since I started off in, Lincolnshire, the county I live in. Then ended up in Leicestershire for a bit, followed by Rutland, then back into Lincolnshire.

I covered 27.72 miles, mainly on nice quiet country roads! Which are, of course my favourite type of roads. During the cycle, I even stopped to take some photos and filmed a new vlog!! 🙂

I will now leave you with the route map, elevation graph and route statistics.

Route map:-

25-05-2015 - bike ride route map

Elevation graph:-

Route statistics:-

  • Start time: 1:57 pm.
  • Distance: 27.72 miles.
  • Time: 2:18:09 (h:m:s).
  • Elapsed Time: 2:54:55 (h:m:s).
  • Avg Speed: 12 mph.
  • Max Speed: 35.3 mph.
  • Elevation Gain: 250 meters.
  • Min Elevation: 56 meters.
  • Max Elevation: 163 meters.

Data from: Garmin Connect.

Photos from the cycle:-

Cannondale Pro Cycling Team 2014

Cannondale Pro Cycling Team 2014

Cannondale Pro Cycling Team 2014

Cannondale Pro Cycling Team 2014

Cycling statistics for May 2015 so far…

Now I’ve got around to posting my cycling statistics for last month. Here are the statistics for this monthly so far! Doing much better than last month! Then that’s not hard at all!! 🙂

Here is the data from May 2015 so far:-

  • Total cycles: 8.
  • Total Distance: 160.92 miles.
  • Total Time: 13:14:10 (h:m:s).
  • Avg Speed: 12.2 mph.
  • Max Time: 2:50:27 (h:m:s).
  • Max Speed: 35.7 mph.
  • Avg Distance: 20.11 miles.
  • Max Distance: 34.94 miles (Single cycle).

Data from: Garmin Connect.

April 2015 cycling statistics

Here are my cycling statistics for April 2015. I’ve been putting off, posting the stats for this month! Since I only did one cycle! Yes, just one! Only did 11.21 miles! Even the one cycle, I did was not ever a long one!!!

So I’ve got a hell of a lot of catching up to do!!!

Here is the data from April 2015:-

  • Total cycles: 1
  • Total Distance: 11.21 miles
  • Total Time: 00:54:27 (h:m:s)
  • Avg Speed: 12.3 mph
  • Max Time: 00:54:27 (h:m:s)
  • Max Speed: 31.7 mph
  • Avg Distance: 11.21 miles
  • Max Distance: 11.21 miles (Single cycle)

Data from: Garmin Connect.

24-Mar-2014 : First half century (50 miles) cycle of 2015

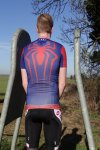
At long last done my first 50 mile cycle of 2015! Hope it’s the first of many! But I don’t think, I will meet a HOT lad dressed in Lycra again, that wanted to try out Amazing Spiderman 2 Morphsuit. Photos to follow!! 😀

I will now leave you with the route map, elevation graph and route statistics.

Route map:-

24-03-2015 - bike ride route map

Elevation graph:-

24-03-2015 - bike ride elevation graph

Route statistics:-

  • Start time: 12:16 pm.
  • Distance: 50.54 miles.
  • Time: 4:17:12 (h:m:s).
  • Elapsed Time: 6:28:18 (h:m:s).
  • Avg Speed: 11.8 mph.
  • Max Speed: 32.2 mph.
  • Elevation Gain: 466 meters.
  • Min Elevation: 58 meters.
  • Max Elevation: 143 meters.

Data from: Garmin Connect.

February 2015 cycling statistics

Here are my cycling statistics for February 2015. I only did, a very poor, 129.22 miles this month. So not doing well at all when it comes to cycling so far this year. Just can’t get myself in the mood for it at all. Just hope that I have a better March!

Here is the data from February 2015:-

  • Total cycles: 5
  • Total Distance: 129.22 miles
  • Total Time: 11:13:22 (h:m:s)
  • Avg Speed: 11.5 mph
  • Max Time: 3:29:42 (h:m:s)
  • Max Speed: 35.7 mph
  • Avg Distance: 25.84 miles
  • Max Distance: 38.84 miles (Single cycle)

Data from: Garmin Connect.

Here are my favourite cycling photos from the month:-

Under Armour Alter Ego Compression Top Amazing Spider ManUnder Armour Alter Ego Compression Top Amazing Spider ManUnder Armour Alter Ego Compression Top Amazing Spider ManUnder Armour Alter Ego Compression Top Amazing Spider ManUnder Armour Alter Ego Compression Top Amazing Spider ManUnder Armour Alter Ego Compression Top Amazing Spider Man

18-Feb-2015 : Starting to get back into cycling!

At long last, think I have got the cycling bug back! Did 23.13 miles, which takes my monthly total to 61.97 miles. Which is still not great, but much better than it was! They are saying it will rain tomorrow. So that, will be the real test! Will or won’t get out a cycle, that is the question!!!??

I will now leave you with the route map, elevation graph and route statistics.

Route map:-

18-02-2015 bike ride

Elevation graph:-

18-02-2015 bike ride elevation graph

Route statistics:-

  • Start time: 1:44 pm.
  • Distance: 23.13 miles.
  • Time: 2:02:06 (h:m:s).
  • Elapsed Time: 2:30:42 (h:m:s).
  • Avg Speed: 11.4 mph.
  • Max Speed: 31.8 mph.
  • Elevation Gain: 228 meters.
  • Min Elevation: 44 meters.
  • Max Elevation: 99 meters.

Data from: Garmin Connect.

17-Feb-2015 : First good cycle of the year

Hoping that at long last this year, I am going to start getting back into cycling. So far this year, I have only done 82 miles. When normally by now, I’ve done at least 500 miles. So this month, I am going to have to try to get more of miles in. Which is not going to be easy. Since more than half the month is already gone. And I’ve only done one cycle! But at least at 38.84 miles, it was a good one! 🙂

I will now leave you with the route map, elevation graph and route statistics.

Route map:-

17-02-2015 bike ride

Elevation graph:-

17-02-2015 bike ride elevation graph

Route statistics:-

  • Start time: 11:44 am.
  • Distance: 38.84 miles.
  • Time: 3:29:42 (h:m:s).
  • Elapsed Time: 4:43:42 (h:m:s).
  • Avg Speed: 11.1 mph.
  • Max Speed: 29.3 mph.
  • Elevation Gain: 350 meters.
  • Min Elevation: 31 meters.
  • Max Elevation: 140 meters.

Data from: Garmin Connect.

Photos from the cycle:-

Under Armour Alter Ego Compression Top Amazing Spider Man

Under Armour Alter Ego Compression Top Amazing Spider Man

Under Armour Alter Ego Compression Top Amazing Spider Man

Under Armour Alter Ego Compression Top Amazing Spider Man

October 2014 cycling statistics

Here are my cycling statistics for October 2014. I did 401.31 miles this month. Which I am, just about happy with. Since it’s the most miles, I have ever done in October. Still was hoping to do much more. Since I am way down on the number of miles, I was at this point last year!

This time last year, I was at 5,115.2 miles. Right now, I am only at 4,676.5 miles. So got a hell of a lot, of catching up to do!!!

Here is the data from October 2014:-

  • Total cycles: 16
  • Total Distance: 401.31 miles
  • Total Time: 32:45:05 (h:m:s)
  • Avg Speed: 12.3 mph
  • Max Time: 3:14:47 (h:m:s)
  • Max Speed: 33.1 mph
  • Avg Distance: 25.08 miles
  • Max Distance: 39.15 miles (Single cycle)
  • Max Daily Distance: 56.87 miles (Multiple cycles)

Data from: Garmin Connect.

Here are my favourite cycling photos from the month:-

Nike Long Sleeve Compression Top

Nike Long Sleeve Compression Top

Nike Long Sleeve Compression Top

Wetsuit cycling

Wetsuit cycling