Tag: cycling statistics

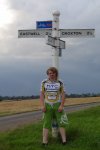
Photos from today’s mini 35 mile cycle

Here are some photos from today’s mini 35.24 mile cycle.

Route statistics:-

  • Distance: 35.24 miles
  • Time: 2:51:17 (h:m:s)
  • Avg Speed: 12.3 mph
  • Max Speed: 34 mph
  • Elevation Gain: 346 meters
  • Min Elevation: 43 meters
  • Max Elevation: 128 meters

Data from: Garmin Connect.

Second ever 100 mile bike ride

I am so pleased with myself. I have just done, my second 100+ mile cycle ever!! The last time I did 100+ miles was back in September last year. Check out the post: First ever 100 mile bike ride to see the route I took then.

Lucky I planned the route in my head this time. So did not have to mini cycle around my village to get the miles up. Also really liked this road, covered lots of new roads. So glad I had a OS map with me, to stop myself from getting lost.

I will now leave you with the route map, elevation graph, route statistics and photos.

The dark blue section of the route, shows new roads I covered during the cycle.

Elevation graph:

Route statistics:-

  • Distance: 101.61 miles
  • Time: 8:01:12 (h:m:s)
  • Avg Speed: 12.7 mph
  • Max Speed: 30.1 mph
  • Elevation Gain: 882 meters
  • Min Elevation: 4 meters
  • Max Elevation: 179 meters

Data from: Garmin Connectconnect.garmin.com/modern/activity/213419058.

Photos from the cycle:-

Out cyclingOut cyclingOut cyclingGarmin Edge 705 - showing 101.6 miles

Longest cycle of this month (August) so far…

I am well pleased with this cycle route. Mainly due to finding lots of new roads to cycle on. It’s also the longest cycle of the month so far. It also brings my total distance so far this month to 422.3 miles. So only got another 218.5 more to go, to beat August’s 2011 total.

I will now leave you with the route map, elevation graph, route statistics and photos.

The dark blue section of the route, shows new roads I covered during the cycle.

Elevation graph:

Route statistics:-

  • Distance: 50.30 miles
  • Time: 4:00:57 (h:m:s)
  • Avg Speed: 12.5 mph
  • Max Speed: 28.5 mph
  • Elevation Gain: 523 meters
  • Min Elevation: 43 meters
  • Max Elevation: 179 meters

Data from: Garmin Connect.

Photos from the cycle:-

Nalini Columbia Highroad Team kit

Nalini Columbia Highroad Team kit

Out cycling with Waltham TV Transmitter in the background

Out cycling with Waltham TV Transmitter in the background

Done 24,999.9 miles of cycling since April 2003

I am pleased to say I have now done 24,999.9 miles of cycling since April 2003. Just wish I had kept a full log, since I first got into cycling. Still that number of miles in 9 years is not bad going. It works out as around 2,777 miles every year.

Here is the yearly total for each year between 2003 and 2012.

  • 2003 : 1,148.7
  • 2004 : 1,585.6
  • 2005 : 2,091.8
  • 2006 : 2,166.3
  • 2007 : 1,072.7
  • 2008 : 1,807.5
  • 2009 : 2,685.9
  • 2010 : 4,001.3
  • 2011 : 5,066
  • 2012 : 3,374

July 2012 cycling statistics

Here are my cycling statistics for July 2012. Could have done better, ended the month doing 223.1 miles less than I did in July 2011.

So far my yearly stands at 3,257.6 miles. Total miles since April 2003 is now at 24,883.4.

Here is the data from July 2012:-

  • Total cycles: 23
  • Total Distance: 536.69 miles
  • Total Time: 42:38:41 (h:m:s)
  • Avg Speed: 12.6 mph
  • Max Time: 3:13:13 (h:m:s)
  • Max Speed: 31.6 mph
  • Avg Distance: 23.33 miles
  • Max Distance: 42.70 miles

Data from: Garmin Connect.

Here are my favourite cycling photos from the month:-

Out cycling

Out cycling

Out cycling

 Out cycling

RST Pro Series 1 Piece Leather Suit local woods

I had great fun putting on my RST Pro Series 1 Piece Leather Suit, then my cycling waterproofs on over the top, so no one could tell what I was wearing. Then I cycled to some local woods to take these photos! Hope you like them, after how hot I got cycling there!!

I will leave you with the cycling statistics. Which will give you an better idea for how long I was geared for up!!

Route statistics:-

  • Distance: 8.91 miles.
  • Time: 00:42:48 (h:m:s).
  • Avg Speed: 12.5 mph.
  • Max Speed: 31.6 mph.
  • Elevation Gain: 85 meters.
  • Min Elevation: 31 meters.
  • Max Elevation: 76 meters.

Data from: Garmin Connect.

June 2012 cycling statistics

Here are my cycling statistics for June 2012. Could have done better, ended the month doing 50.2 miles less than I did in June 2011 :(.

So far my yearly stands at 2,720.9 miles. Total miles since April 2003 is now at 24,346.7.

Here is the data from June 2012:-

  • Total cycles: 17
  • Total Distance: 406.39 miles
  • Total Time: 31:07:27 (h:m:s)
  • Avg Speed: 13.1 mph
  • Max Time: 3:17:11 (h:m:s)
  • Max Speed: 33.6 mph
  • Avg Distance: 23.91 miles
  • Max Distance: 41.21 miles

Data from: Garmin Connect.

Here are my favourite cycling photos from the month:-

Out cyclingOut cyclingPBK Team Long Sleeve Skinsuit 2009Out cyclingOut cycling

Waltham TV Transmitter cycle loop

Happy days, at long last I have done my first long cycle of the month. Till now, only been doing 20 miles cycles, mainly due to weather not being at it’s best for cycling. Put it this way, I last went out a cycle on the 7th June and my cycling shoes are still not fully dry.

I am very pleased with how this cycle turned out. Ended up covering lots of roads I have never been on before. Even found my local TV Transmitter :).

I will now leave you with the route map, elevation graph, route statistics and photos.

Route map:-

The dark blue section of the route, shows new roads I covered during the cycle.

Elevation graph:-

Route statistics:-

  • Distance: 40.70 miles.
  • Time: 3:01:02 (h:m:s).
  • Avg Speed: 13.5 mph.
  • Max Speed: 28.6 mph.
  • Elevation Gain: 441 meters.
  • Min Elevation: 43 meters.
  • Max Elevation: 163 meters.

Data from: Garmin Connect.

Photos from the cycle:-

Out cycling with Waltham TV Transmitter in the background

Out cycling

Out cycling

May 2012 cycling statistics

Here are my cycling statistics for May 2012. Well pleased with my statistics for this month.

So far my yearly stands at 2,314.5 miles. Total miles since April 2003 is now at 23,940.3.

Here is the data from May 2012:-

  • Total cycles: 21
  • Total Distance: 599.65 miles
  • Total Time: 47:52:33 (h:m:s)
  • Avg Speed: 12.5 mph
  • Max Time: 5:31:03 (h:m:s)
  • Max Speed: 33.1 mph
  • Avg Distance: 28.55 miles
  • Max Distance: 71 miles

Data from: Garmin Connect.

Here are my favourite cycling photos from the month:-

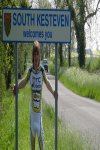
Cycling at Loch KatrineView from Queen's View car park Flanders Moss sign postSouth Kesteven signdsc00394

First 70+ mile cycle of the year!

Well pleased, with myself. When I set off, I was only planning to do around 32 miles, some how that turned into a 71 mile bike ride :).

I will now leave you with the route map, elevation graph and route statistics.

Route map:-

Elevation graph:-

Route statistics:-

  • Distance: 71 miles.
  • Time: 5:31:03 (h:m:s).
  • Avg Speed: 12.9 mph.
  • Max Speed: 29.7 mph.
  • Elevation Gain: 599 meters.
  • Min Elevation: 14 meters.
  • Max Elevation: 164 meters.

Data from: Garmin Connect.