I am really on fire this month! So far done 459 miles. Which is 223.6 more miles than I did in November of last year (2012). It’s also the third 40+ mile cycle of the month! The way I am going, I will hit 600 miles before the month is out. Well if the weather plays nice that is!
I will now leave you with the route map, elevation graph, route statistics and photos.
Route map:-

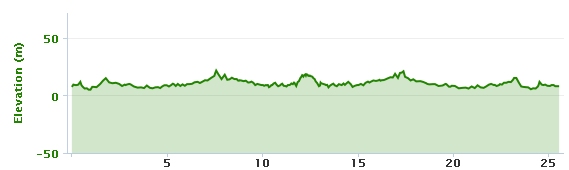
Elevation graph:–

Route statistics:-
- Start time: 10:41 am.
- Distance: 44.43 miles.
- Time: 3:41:45 (h:m:s).
- Elapsed Time: 5:16:17 (h:m:s).
- Avg Speed: 12 mph.
- Max Speed: 27.3 mph.
- Elevation Gain: 730 meters.
- Min Elevation: 27 meters.
- Max Elevation: 141 meters.
Data from: Garmin Connect.
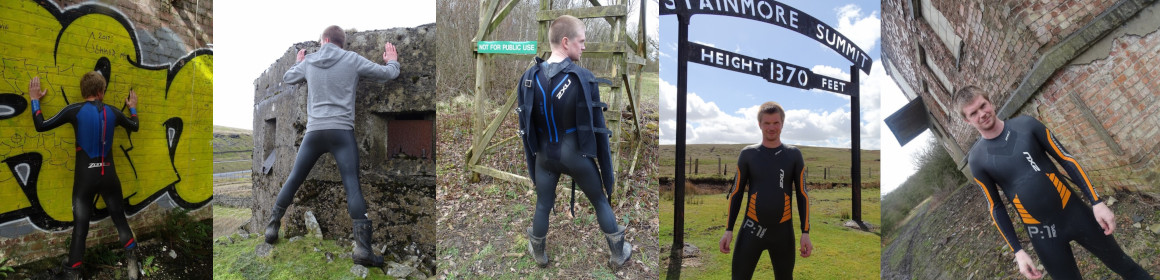
Photos from the cycle:-