Well that turned out to be a very, very wet and cold cycle. I am so glad I was wearing my wetsuit, under my cycling gear. Only bit of me that got cold was my feet, even in my winter cycling boots. Did not help they filled up with freezing cold rain water. So I was really glad when the cycle was over and I got my shoes off!
I will now leave you with the route map, elevation graph, route statistics and photos.
Route map:-

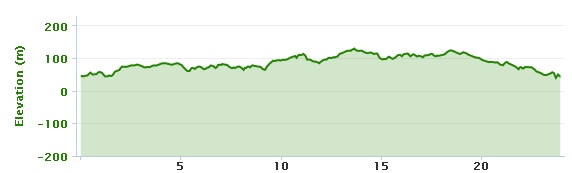
Elevation graph:–

Route statistics:-
- Distance: 28.44 miles.
- Time: 2:23:04 (h:m:s).
- Avg Speed: 11.9 mph.
- Max Speed: 28.7 mph.
- Elevation Gain: 272 meters.
- Min Elevation: 44 meters.
- Max Elevation: 136 meters.
Data from: Garmin Connect.
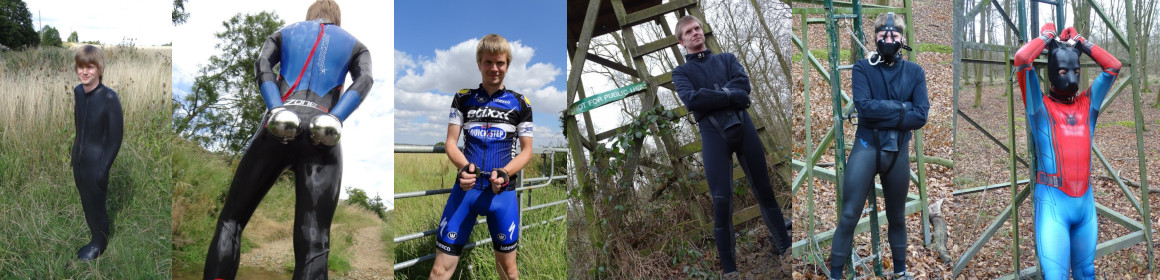
Photos from the cycle:-