Category: cycle route

04-Feb-2013 : 20 mile cycle with 40+ mph wind speed

Oh dear, oh dear. It was yet another very windy cycle. I believe that the wind speed went above 40 mph at times. It was OK when the wind was behind me, or even side on. But was hell when cycling head on into it. So only did 21.91 miles. Still not to bad and takes my monthly total so far up to 64.5 miles.

I will now leave you with the route map, elevation graph and route statistics.

Route map:-

04-02-2013 bike ride

Elevation graph:

04-02-2013 bike ride elevation graph

Route statistics:-

  • Distance: 21.91 miles.
  • Time: 1:47:49 (h:m:s).
  • Avg Speed: 12.2 mph.
  • Max Speed: 27.8 mph.
  • Elevation Gain: 190 meters.
  • Min Elevation: 23 meters.
  • Max Elevation: 95 meters.

Data from: Garmin Connect.

03-Feb-2013 : Yet another very windy cycle

The weather so far this year has not really been the best for cycling. First it was snow, then the ice that followed. Then for the last number of days, it’s been very, very windy. So only did just over 23 miles today. Looking at the weather the snow is coming back later this week. So I best get all the cycling done, before that happens. Really need to get the miles in this month to catch up on some of the miles I lost, last month.

I will now leave you with the route map, elevation graph and route statistics.

Route map:-

03-02-2013 bike ride

Elevation graph:

03-02-2013 bike ride elevation graph

Route statistics:-

  • Distance: 23.76 miles
  • Time: 1:55:23 (h:m:s)
  • Avg Speed: 12.4 mph
  • Max Speed: 29.2 mph
  • Elevation Gain: 279 meters
  • Min Elevation: 37 meters
  • Max Elevation: 99 meters

Data from: Garmin Connect.

29-Jan-2013 : Longest cycle of January 2013 so far!

That’s more like it. Just beating my longest January cycle ever. Which I set on Sunday 29th January 2012. Which happens to be 1 year ago today. I only just worked that out, when looked at my cycle log.  Also happy now my total for this month is looking much better! Still way, way down on January 2012. But much better than I was doing two days ago!!

I will now leave you with the route map, elevation graph and route statistics.

Route map:-

29-01-2013 bike ride

Elevation graph:

29-01-2013 bike ride elevation graph

Route statistics:-

  • Distance: 37.28 miles
  • Time: 3:04:59 (h:m:s)
  • Avg Speed: 12.1 mph
  • Max Speed: 28.7 mph
  • Elevation Gain: 307 meters
  • Min Elevation: 30 meters
  • Max Elevation: 143 meters

Data from: Garmin Connect.

28-Jan-2013 : First wetsuited cycle of 2013!

Well pleased with myself. At first I was not going to do any cycling at all today, due to strong winds. When I checked the wind speed before setting up is was showing wind speeds of 60 mph. But since my miles so far this month has been very, very low. Due to having about 2 week of no cycling due to snow and ice. I made up my mind, to hell if it and went out! I ended up doing the longish cycle of the year so far. I did 28.94 miles, but my avg speed was a bit on the slow side, to the very strong head winds.

It also happens to be my first wetsuited cycle of the year!! The wind was so cold, I so glad I had it on!

I will now leave you with the route map, elevation graph, route statistics and photos.

Route map:-

28-01-2013 bike ride

Elevation graph:

28-01-2013 bike ride elevation graph

Route statistics:-

  • Distance: 28.94 miles
  • Time: 2:45:12 (h:m:s)
  • Avg Speed: 10.5 mph
  • Max Speed: 28.2 mph
  • Elevation Gain: 332 meters
  • Min Elevation: 43 meters
  • Max Elevation: 136 meters

Data from: Garmin Connect.

Photos from the cycle:-

Wetsuit cycling

Wetsuit cycling

Wetsuit cycling

08-Jan-2013 : Third cycle of 2013!

Now done my third cycle of 2013. You may have noticed I have been posting every cycle route of the year so far. The aim is, I will do a post about every cycle over 20 miles. Does mean, I will need to try to do lots of different routes. If I don’t, you will get bored of seeing much the same maps all the time!

I will now leave you with the route map, elevation graph and route statistics.

Route map:-

08-01-2013 bike ride

Elevation graph:

08-01-2013 bike ride elevation graph

Route statistics:-

  • Distance: 23.96 miles.
  • Time: 1:57:29 (h:m:s).
  • Avg Speed: 12.2 mph.
  • Max Speed: 36.1 mph.
  • Elevation Gain: 244 meters.
  • Min Elevation: 38 meters.
  • Max Elevation: 129 meters.

Data from: Garmin Connect.

07-Jan-2013 : Second cycle of 2013!

Now done my second cycle of 2013. Don’t worry, I will start to think of a new title soon. If I don’t, will soon end up being 100th cycle of the year!! Jokes!!

I will now leave you with the route map, elevation graph and route statistics.

Route map:-

07-01-2013 bike ride

Elevation graph:

07-01-2013 bike ride elevation graph

Route statistics:-

  • Distance: 22.20 miles.
  • Time: 1:46:21 (h:m:s).
  • Avg Speed: 12.5 mph.
  • Max Speed: 33.3 mph.
  • Elevation Gain: 215 meters.
  • Min Elevation: 44 meters.
  • Max Elevation: 143 meters.

Data from: Garmin Connect.

06-Jan-2013 : First cycle of 2013!

That’s 2013 cycling wise off to a great start! I did 24.71 miles. Which I am well happy with. Now only got another 376.29 miles to go, to beat the record number of miles. I set in January 2012 (last year).

I will now leave you with the route map, elevation graph and route statistics.

Route map:-

06-01-2013 bike ride

Elevation graph:

06-01-2013 bike ride elevation graph

Route statistics:-

  • Distance: 24.71 miles.
  • Time: 2:00:19 (h:m:s).
  • Avg Speed: 12.3 mph.
  • Max Speed: 29 mph.
  • Elevation Gain: 270 meters.
  • Min Elevation: 29 meters.
  • Max Elevation: 128 meters.

Data from: Garmin Connect.

Done 256.3 miles this month, got another 288 to do

I have done 256.3 miles so far this month. Got another 288 to do, to bet September 2011 total. If I had a whole month to do that number of miles in. It would be easy. But since I go on holiday on the 23rd, only got up till then to do it! So the weather better play nice!!

I will now leave you with the route map, elevation graph, route statistics and photos.

Route map:-

Elevation graph:

Route statistics:-

  • Distance: 26.24 miles
  • Time: 26.24 (h:m:s)
  • Avg Speed: 12.4 mph
  • Max Speed: 30.6 mph
  • Elevation Gain: 387 meters
  • Min Elevation: 23 meters
  • Max Elevation: 95 meters

Data from: Garmin Connect.

Photos from the cycle:-

PBK Team Long Sleeve Skinsuit

PBK Team Long Sleeve Skinsuit

PBK Team Long Sleeve Skinsuit

Second ever 100 mile bike ride

I am so pleased with myself. I have just done, my second 100+ mile cycle ever!! The last time I did 100+ miles was back in September last year. Check out the post: First ever 100 mile bike ride to see the route I took then.

Lucky I planned the route in my head this time. So did not have to mini cycle around my village to get the miles up. Also really liked this road, covered lots of new roads. So glad I had a OS map with me, to stop myself from getting lost.

I will now leave you with the route map, elevation graph, route statistics and photos.

The dark blue section of the route, shows new roads I covered during the cycle.

Elevation graph:

Route statistics:-

  • Distance: 101.61 miles
  • Time: 8:01:12 (h:m:s)
  • Avg Speed: 12.7 mph
  • Max Speed: 30.1 mph
  • Elevation Gain: 882 meters
  • Min Elevation: 4 meters
  • Max Elevation: 179 meters

Data from: Garmin Connectconnect.garmin.com/modern/activity/213419058.

Photos from the cycle:-

Out cyclingOut cyclingOut cyclingGarmin Edge 705 - showing 101.6 miles

First ever 100 mile bike ride

I am so pleased with myself, I did my first ever 100 mile bike ride today. It’s been one of my cycling goal’s since doing the End to End cycle back in August 2009. The only bad thing about it, was finding roads to get to 100 miles. If you have a close look at the map, you can see where I had to go, a mini cycle around Castle Bytham and my home village of Little Bytham to get the miles up.

So next time I plan a 100+ mile bike ride, I will need to sort out the route before I set off and may even go for 120 miles the next time :). But I ca’t see it happening this year, since it gets dark around 7:30pm now. So it will give me something to look forward to next year!

So now on with some of the statistics from the cycle.

  • Distance: 100.44 miles.
  • Time: 7:20:29 (h:m:s).
  • Avg Speed: 13.7 mph.
  • Max Speed: 26.5 mph.
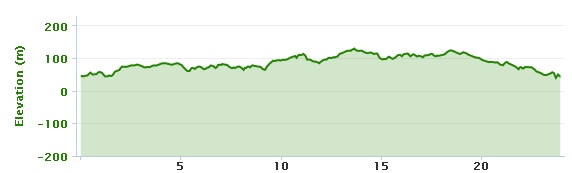
  • Elevation Gain: 709 meters.

Data from: Garmin Connectconnect.garmin.com/modern/activity/114613864.

Below is the route I took while doing the 100.44 mile cycle.

In case you can’t really picture 100 miles in your head. It’s like cycle from Stamford to Cambridge and back again and still having around 10 miles to play with. Or cycling from Stamford to Sheffield and still having 12 miles to play with.

Oh and sorry I took no photos at all during the cycle. No idea why, on the longer cycles, I next to never stop to take any :(.