This cycle ended up being a lot longer than planned. When I set off my goal was so do around 25 miles, but I ended up doing 33.76. Making it the longest cycle of February 2013 so far. It also ended up being the cycle with the best average speed so far, set at 13.3 mph.
I only took two photos during the cycle. All at the same location, which was next to the A1 between Little Ponton and Great Ponton. So here is my favourite out of the two of them.

I will now leave you with the route map, elevation graph and route statistics.
Route map:-

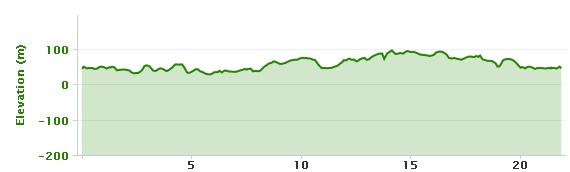
Elevation graph:–

Route statistics:-
- Distance: 33.76 miles.
- Time: 2:32:23 (h:m:s).
- Avg Speed: 13.3 mph.
- Max Speed: 31.7 mph.
- Elevation Gain: 326 meters.
- Min Elevation: 43 meters.
- Max Elevation: 136 meters.
Data from: Garmin Connect.