I am so happy! This time I made it all the way from Killearn to Inversnaid. If you have been following this website for a good while. You may remember that way back in October 2011, I did try to do this cycle. But due to running out day light, I only made it to Loch Arklet then had to turn back. So this time, I made sure I set off at the better time. Also it helped since, I did it during summer. So had many more hours of day light to play with!
After doing this cycle, it’s going to make cycling around Lincolnshire, look very boring indeed! It may not the very good from the route map below. If you check it out on google street view, you will see why I loved doing it to much!
I will now leave you with the route map, elevation graph, route statistics and photos.
Route map:-

The dark blue section of the route, shows new roads I covered during the cycle.
Elevation graph:–

Route statistics:-
- Distance: 59.19 miles.
- Time: 4:37:35 (h:m:s).
- Avg Speed: 12.8 mph.
- Max Speed: 30.3 mph.
- Elevation Gain: 1,287 meters.
- Min Elevation: 13 meters.
- Max Elevation: 197 meters.
Data from: Garmin Connect.
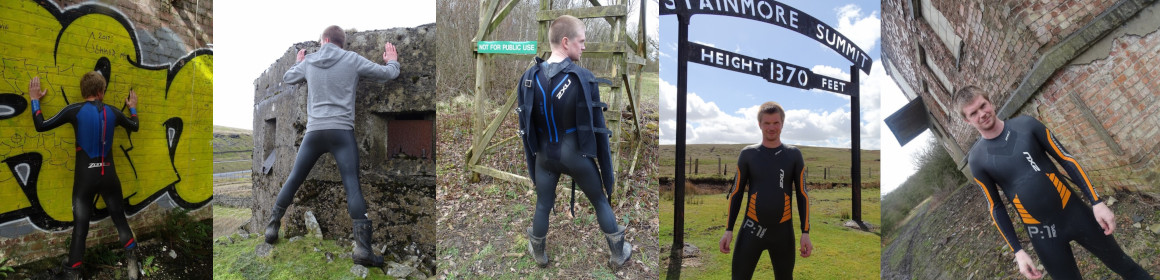
Photos from the cycle:-


")
")

